Download App


11 Feb 2024

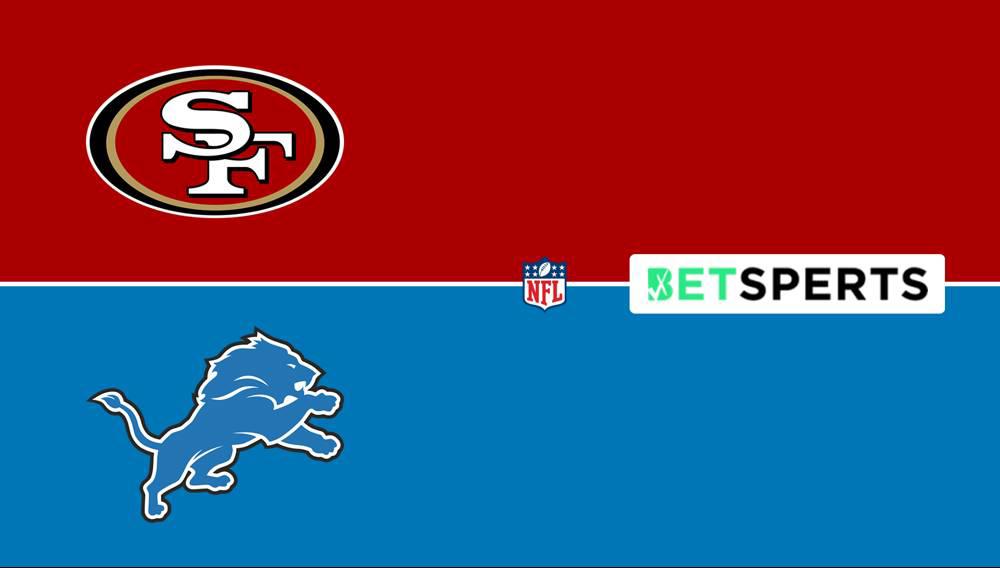
Kansas City Chiefs
KC
NFL
2022-10-23 16:25:00
Levis Stadium at Santa Clara, CA USA

San Francisco 49ers
SF
Chiefs vs 49ers Analysis
#1 social media Network
for bettors
Chiefs VS 49ers game history
See All|
Kansas City Chiefs
|
||||
| WK | DATE | OPP | RESULT | RECORD |
| No record found | ||||
|
San Francisco 49ers
|
||||
| WK | DATE | OPP | RESULT | RECORD |
| No record found | ||||
Chiefs VS 49ers betting trends
See All|
Kansas City Chiefs
|
||||
| DATE | SCORE | SPREAD | OVER/UNDER | |
| 01/07/24 |
KC 13 @ LAC 12
|
KC 3.5
|
35 points
|
|
| 12/31/23 |
KC 25 vs CIN 17
|
KC -7
|
45.5 points
|
|
| 12/25/23 |
KC 14 vs LV 20
|
KC -11
|
40.5 points
|
|
| 12/17/23 |
KC 27 @ NE 17
|
KC -10
|
39.5 points
|
|
| 12/10/23 |
KC 17 vs BUF 20
|
KC -1.5
|
49.5 points
|
|
|
San Francisco 49ers
|
||||
| DATE | SCORE | SPREAD | OVER/UNDER | |
| 01/07/24 |
SF 20 vs LAR 21
|
SF -5.5
|
40 points
|
|
| 12/31/23 |
SF 27 @ WAS 10
|
SF -14
|
48.5 points
|
|
| 12/25/23 |
SF 19 vs BAL 33
|
SF -6.5
|
46.5 points
|
|
| 12/17/23 |
SF 45 @ ARI 29
|
SF -11
|
47 points
|
|
| 12/10/23 |
SF 28 vs SEA 16
|
SF -14.5
|
44.5 points
|
|
Chiefs VS 49ers players
Load More
Chiefs VS 49ers team stats
See All
Kansas City Chiefs
KC
San Francisco 49ers
SF